Introduction
Generators are prominent components of the backup power supply systems. They offer seamless energy, but their downtime is even more lost. Due to unexpected moments, outages, or sometimes low-quality generators with low reliability, downtime losses are created. This is where you must know the generator reliability metrics.
Today, we will understand the generator reliability metrics and know how they work and help evaluate the performance.
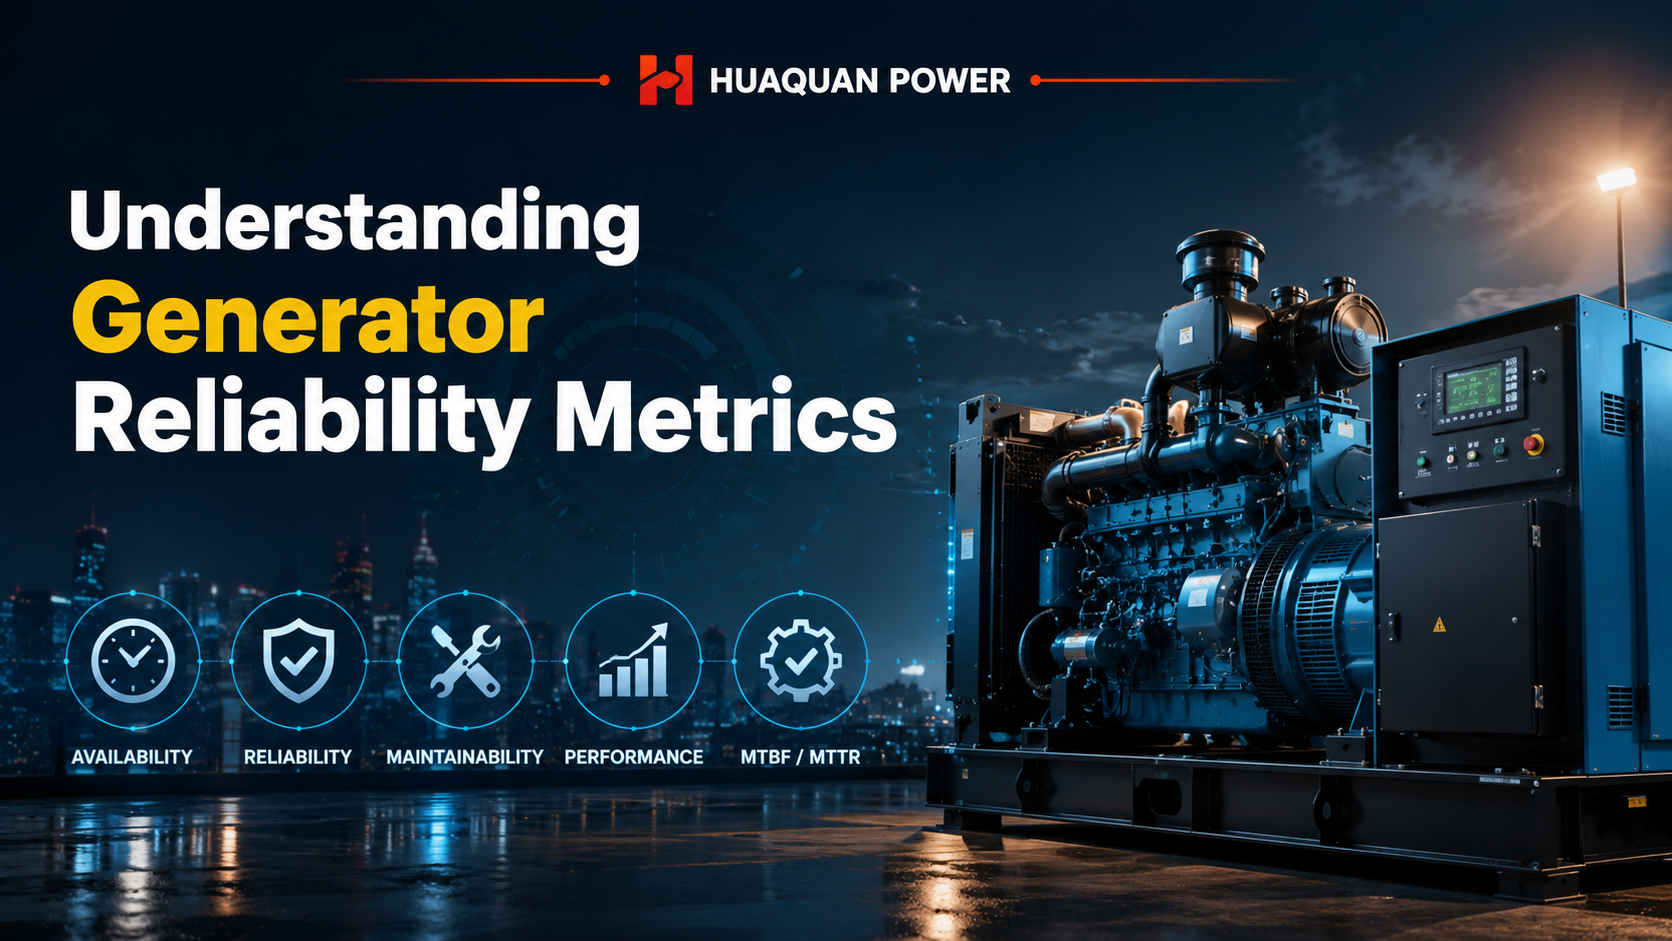
What Are Generator Reliability Metrics?
Generator reliability metrics are all the key parameters that determine the overall performance of the generators. They are the key factors upon which a generator is tested and measured for its performance.
Here are a few key factors on which generator reliability metrics depend.
- Frequency of failures
- Operating life before breakdown
- Repair duration
- Equipment availability
- Maintenance effectiveness
- Overall operational efficiency
Instead of focusing on whether the generator is reliable or not, you should focus on how reliable the generator is based on the performance indicators.
Key Generator Reliability Metrics
Are you ready to explore the generator reliability metrics and understand the performance of the generators? The most important performance metrics include:
- Mean Time Between Failures (MTBF)
- Mean Time To Repair (MTTR)
- Availability
- Failure Rate
- Reliability Percentage
- Service Life
- Maintenance Compliance
- Load Factor
- Forced Outage Rate
Each metric has a unique insight and is discussed below to help you better understand it.
Metric 1: Mean Time Between Failures (MTBF)
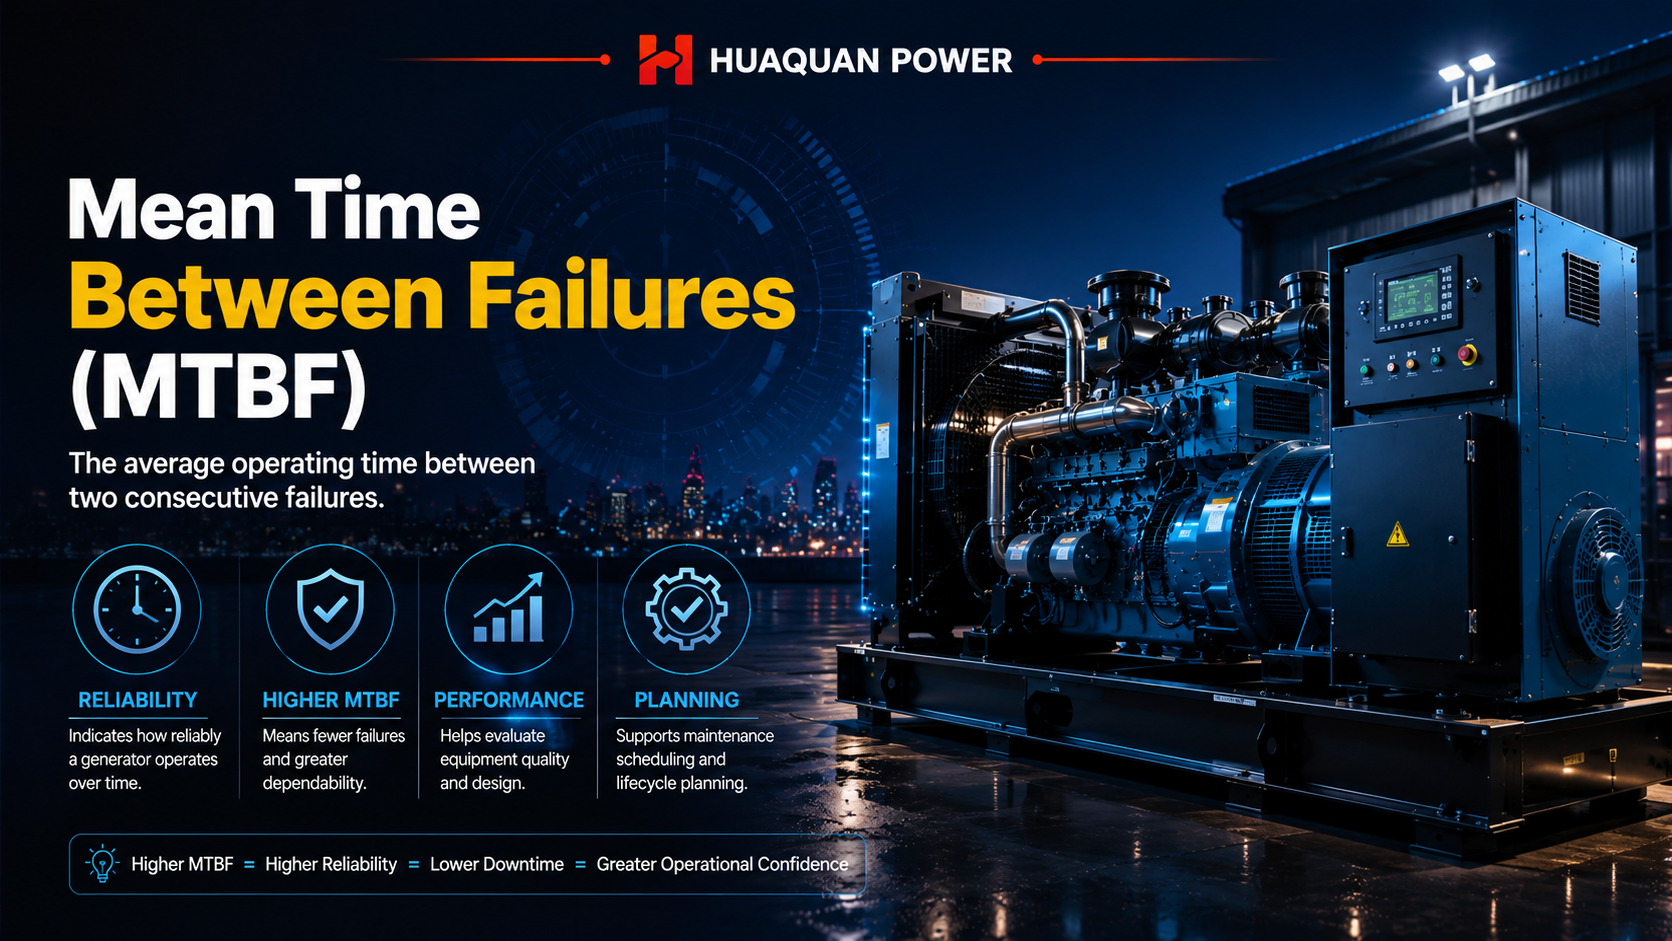
MTBF indicates the time before a failure occurs. Suppose you have installed a generator and it fails after 2000 hours of operation. The MTBF is 2000 hours.
High MTBF
High MTBF means a lower number of failures between a higher number of hourly operations. Consider an example of a generator that experiences two failures after 6000 hours.
Let’s calculate the MTBF.
MTBF = Total Operating Hours ÷ Number of Failures = 6000 ÷ 2 =3000 hours
So, the MTBF is 3000 hours, which is technically high. The benefits and key features of the high MTBF are:
- It shows the generator is highly reliable.
- This performance metric indicates high-quality generators.
Low MTBF
Low MTBF indicates lower performance compared to high MTBF. It means the generator breaks down more often.
Suppose an example of a generator which experiences 6 failures in 6,000 hours of operation.
MTBF = 6000/6 = 1000 hours
The MTBF will be 1000 hours, which is technically less and indicates:
- The generator is not highly reliable.
- Performance is low and not as expected.
- You might have installed the low-quality generators.
If you want to further understand these parameters, we have added the comprehensive table here.
| Generator Model | Operating Hours | Failures | MTBF |
| Generator A | 20,000 | 5 | 4,000 hours |
| Generator B | 20,000 | 10 | 2,000 hours |
| Generator C | 20,000 | 20 | 1,000 hours |
Metric 2: Mean Time To Repair (MTTR)
MTTR also matters a lot. It shows the average time taken to repair and restore a generator failure. A few generators are faster to repair, while others can take more time.
Let’s know the example here.
Formula
MTTR = Total Repair Time ÷ Number of Repairs
Example
Total repair time:
40 hours
The number of repairs is 8.
MTTR = 40 ÷ 8 = 5 hours
It means the generator takes 5 hours to repair.
Why Does It Matter?
You might wonder why the mean repair time matters. There are a few reasons behind this secret. For example:
- It shows how fast your generator can come back to its original state.
- Faster servicing and repair can reduce the latency and improve the efficiency.
- It shows the reliability status of the generators. Faster repair means the generator is more reliable.
Important Note: A generator with an MTBF can require a longer time to repair. So, you should choose the generators based on different performance indicators.
Metric 3: Generator Availability
Generator Availability is also a crucial factor that helps understand when and how the generator is available.
Suppose a generator has broken down. We calculate its overall performance and check the repair time. Then we measure the overall power.
Example
Availability = MTBF ÷ (MTBF + MTTR)
Example:
MTBF = 4,000 hours
MTTR = 5 hours
Availability = 4000 ÷ 4005 = 99.88%
There are different availability levels that help you understand when and how you should choose the generators.
| Availability | Performance |
| 95% | Acceptable |
| 98% | Good |
| 99% | Very Good |
| 99.50% | Excellent |
| 99.90% | Mission Critical |
Metric 4: Failure Rate
Failure rate is a key indicator of the reliability of the generators. It shows how often your generator fails to perform while operating. You can consider it another parameter to check reliability.
Examples
The examples are here with the formula to calculate the failure per hour or 2000 hours, as you want to.
Failure Rate = Number of Failures ÷ Total Operating Hours
Example:
10 failures
20,000 operating hours
Failure Rate
10 ÷ 20,000
= 0.0005 failures/hour
Or
One failure every 2,000 hours.
Understanding Failure Rates
Failure rates often follow the bathtub curve and have the following aspects to know.
Early Life
Early life failures are not that typical. They can occur due to several reasons, but are very critical for the generator operations. Here are a few defective conditions that cause early life failures.
- Manufacturing defects
- Installation mistakes
- Component weaknesses
The failure rate is relatively high because of these components.
Useful Life
If you have successfully installed and operated the generators, it shows:
- Stable operation
- Predictable performance
- Low failure rate
With this period and performance, generators are less likely to break down. In simple words, it is the longest operating period without early failures.
Wear-Out Period
As the generator is used, its components start wearing out after several years. Such a period is the wear-out period and is typical in almost all the lives of the components. Here are a few aspects to know.
- Bearings wear
- Insulation degrades
- Injectors wear
- Cooling systems weaken
Metric 5: Reliability Percentage
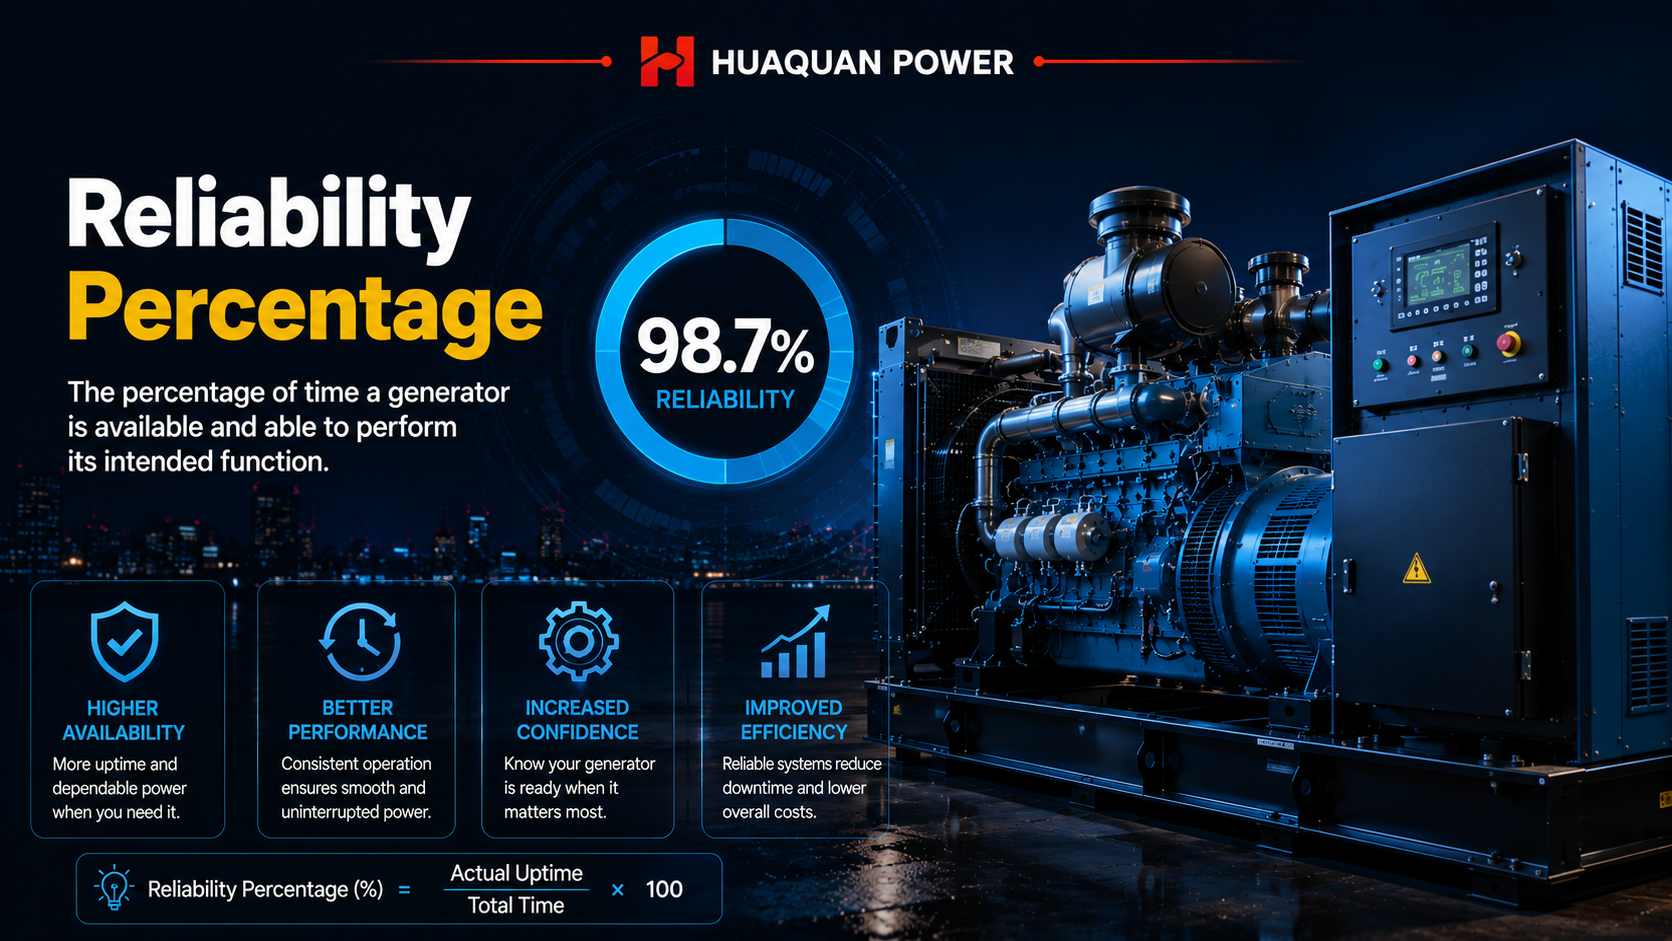
Reliability percentage gives the estimate of the generator reliability after several hours of operation.
For example:
| Time Period | Reliability |
| 100 hours | 99.80% |
| 500 hours | 99.20% |
| 1,000 hours | 98.50% |
| 2,000 hours | 96.90% |
This is extremely critical for those applications that require a consistent power supply without any interruptions. To avoid extended power outages, you must focus on the reliability percentage and choose a quality system.
Metric 6: Service Life
Service life tells about the total hours of performance before a major breakdown. High-end generators have a longer service life compared to the low-quality ones.
Here is the list of a few generator types and their average service life.
Remember, the average service life depends on several factors, such as load conditions, maintenance quality, operating environment, and fuel quality.
Metric 7: Maintenance Compliance
Maintenance is also crucial for the long-term performance of the generators. With the early detection of the faults, you can easily maintain, repair, and ensure the long life of your generators.
For maintenance compliance, you must check the number of maintenance required vs how many maintenance activities you have done.
The calculation formula is simple.
PMC = (Completed Maintenance Tasks ÷ Scheduled Maintenance Tasks) × 100
Compliance targets include:
- Above 98%, it is an Excellent job.
- 95–98% is still a very good range.
- 90–95% of the maintenance task completion is still acceptable
- With 80–90%, you need to improve your maintenance.
- Below 80% causes a high failure risk.
Here is what you should do and maintain during the maintenance hassles.
| Maintenance Task | Recommended Interval |
| Engine oil replacement | 250–500 operating hours |
| Oil filter replacement | Every oil change |
| Fuel filter replacement | 500 hours |
| Air filter inspection | Monthly |
| Coolant inspection | Monthly |
| Battery inspection | Monthly |
| Radiator cleaning | Quarterly |
| Valve adjustment | 1,000–2,000 hours |
| Alternator inspection | Annually |
| Load bank testing | Annually |
Metric 8: Load Factor
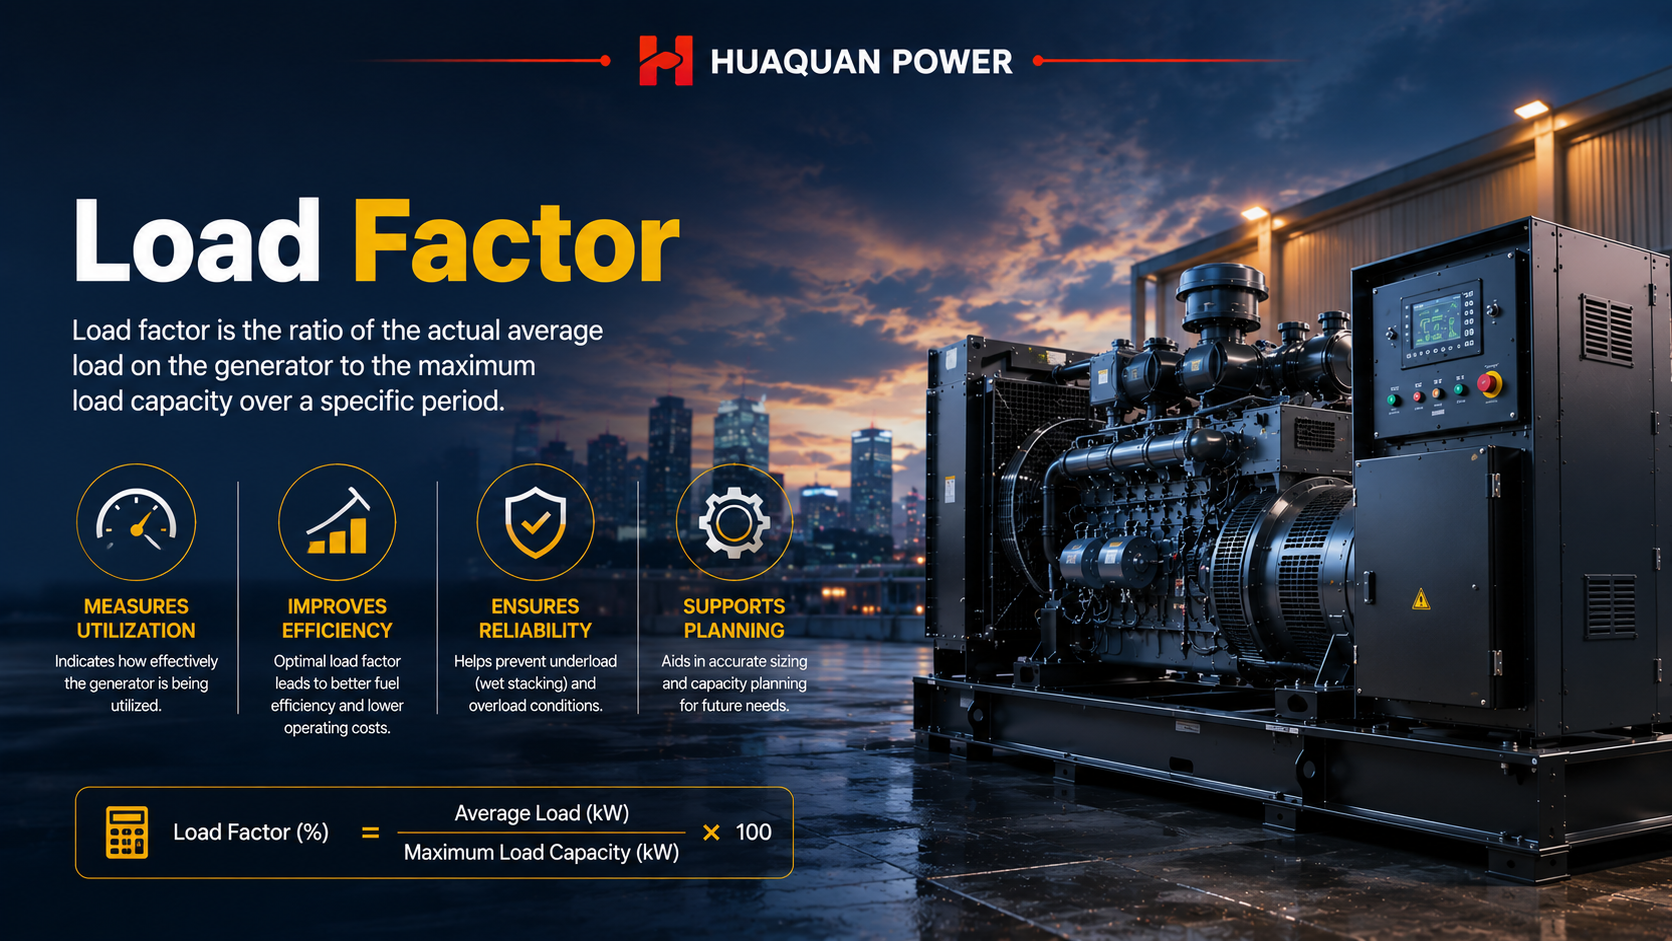
Load factor is also a critical aspect and helps you understand how you have used your generators. It shows the maximum operating load and your operating load ranges.
Example
Load Factor (%) = Average Load ÷ Rated Capacity × 100
Example
Generator Rating = 500 kW
Average Load = 325 kW
Load Factor
= 325 ÷ 500 ×100
= 65%
| Load Factor | Effect on Reliability |
| Below 30% | Wet stacking, carbon buildup |
| 30–50% | Light loading |
| 50–80% | Ideal operating range |
| 80–90% | High efficiency |
| Above 90% | Increased wear and thermal stress |
| 100%+ | Risk of overload |
Low Load
Operating generators at less than 30% of the rated capacity is a low load and has several disadvantages. For example:
- It shows the decreased efficiency.
- Fuel consumption is higher.
- Generators become oversized for such a condition and are a waste of investment.
Medium Load
Medium load is between 30% and 75% of the maximum load. It is a good range and has a higher efficiency, but doesn’t offer maximum savings.
Optimal Load
Optimal load delivers the highest efficiency of the generators. It is a load range of 75-85% and has the following benefits.
- Minimal stress on the generators and high reliability
- Quality operations of the generators
- Premium efficiency with long-standing performance.
Higher Loads
Exceeding 85% of the maximum load is categorized into the higher loads category. It also has a high efficiency but puts more stress on the generators.
Here are a few things to know.
- Efficiency is maximum, but it operates for a few hours.
- Engine stress is higher, and early wear out of components occurs if you run for a long time.
Metric 9: Forced Outage Rate
One of the key parameters for the downtime measurements is the forced outage rate. It shows how the generators have gone down due to unexpected outages.
The calculation formula for the forced outage rate is here.
Forced Outage Rate (%) = (Forced Outage Hours ÷ Total Operating Hours) × 100
Example
Let’s understand the forced outage rate with the example below.
Suppose you have operated the generator for 8760 hours, and it has experienced an outage of 42 hours.
| Parameter | Value |
| Annual Operating Hours | 8,760 hours |
| Forced Outage Hours | 42 hours |
| Planned Maintenance Hours | 60 hours |
| Forced Outage Rate | 0.48% |
A forced outage rate below 1% is still considered a good rate.
| Generator Condition | Forced Outage Rate |
| New premium generator | 0.2–0.5% |
| Well-maintained Industrial Generator | 0.5–1% |
| Average commercial generator | 1–3% |
| Poorly maintained generator | 3–7% |
| Aging equipment | Above 7% |
FAQs
- Can predictive maintenance improve reliability?
Yes, predictive maintenance combined with the data control and forecast systems improves the reliability of the generators. It helps assess vibration, temperature, oil analysis, and fuel quality to identify developing faults.
- How often should generator reliability metrics be reviewed?
You should review the generator reliability metrics every week. You can also review it monthly, quarterly, or sometimes annually, depending on your schedule.
- Does operating at full load reduce generator reliability?
Yes. If you operate the generators at more than 85% of load, it offers efficiency but experiences more stress and shows early wear out of the components. Therefore, reliability decreases in such cases.
- What is considered a good MTBF for an industrial generator?
An MTBF varies depending on the applications and conditions. For example:
- Small commercial generators: 1,500–3,000 hours
- Industrial standby generators: 3,000–5,000 hours
- Premium industrial generators: Above 5,000 hours
- Which generator reliability metric is the most important?
You can’t rely on a single parameter. Instead, you should know all the critical parameters, such as Mean Time Between Failures (MTBF), Mean Time to Repair (MTTR), Availability, Forced Outage Rate (FOR), and Start Reliability together.
- How can remote monitoring improve generator reliability?
Remote monitoring performs several necessary tasks. Therefore, it improves the generator’s reliability and decreases the chances of failure. For example, it tracks oil pressure, coolant temperature, fuel level, battery voltage, engine speed, vibration, and operating hours.
- Which factors have the greatest impact on generator reliability?
There is no single factor, but multiple factors affect the generator reliability. These include:
- Engine and alternator quality
- Fuel quality and storage conditions
- Preventive maintenance practices
- Operating load
- Cooling system performance
- Environmental conditions
- Quality of replacement parts
- Operator training and monitoring
- What availability percentage is recommended for mission-critical facilities?
Mission-critical facilities, such as hospitals, data centers, airports, and telecommunications networks, expect a higher reliability percentage. It should be 99.9% or higher reliability for all such applications.
Conclusion
Generator reliability is pretty critical. Whether you are looking for high performance or lower downtime, these metrics evaluate all the aspects. You don’t have to believe in the fake marketing claims and choose a reliable backup power system for your business.
Are you looking for top-notch and highly reliable quality generators? Contact Huaquan Power. We offer diesel, gas, and hybrid generators that meet all your reliability demands and ensure high-quality power generation. You’ll enjoy high efficiency and lower fuel costs in the long run. Talk to our experts right away!